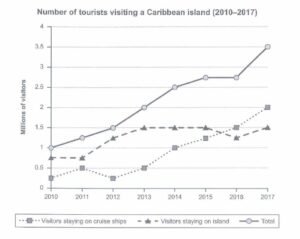
The graph below shows the number of tourists visiting a particular Caribbean island between 2010 and 2017.
Summarise the information by selecting and reporting the main features, and make comparisons where relevant.

The line chart displays the number of foreign visitors who visited a specific Caribbean island over a period of 8 years.
There was a drastic increase in people visiting a specific island from 1 million in 2010 to 3.5 million in 2017. There was a gradual increase in total people from 2010 to 2015 and the same number of people visited in 2015 and 2016, before a sudden increase of 1 million visitors who visited this land.
Nearly 0.25 million tourists stayed on the boat in 2010 and this value increases to 0.5 million in the next year. However, the number of visitors dropped to the level of 2010 and after this year, a gradual increase in people who preferred to stay on the cruise. Two million people stayed on the ship in 2017. However, tourists staying on the land saw fluctuations. An increment was seen from 2011 to 2013 and then, a stable number of visitors stayed on the island for the next three years.
Overall, foreign tourists staying on the boat, the land and in total saw an overall growth over this entire period. There was a gradual increase in people who stayed on the ship and a moderate increment in people living in hotels.
